Basically, the Margin of Safety is the difference between the value of a business (Intrinsic Value) and the price which you pay for that business (market price). It is different from the Investor’s Required Return / Discount Rate and can vary, depending on the perceived risk of the investment. The Margin of Safety is there to; absorb the impact of any unforeseen events that may adversely affect the business or the market in general, minimise the impact of any miscalculations made during the valuation process, allow for small declines in the company’s future earnings power, as well as taking into account your own risk tolerance. It is imperative not to use the Margin of Safety to justify the purchase of undervalued stocks if their fundamentals aren’t sound.
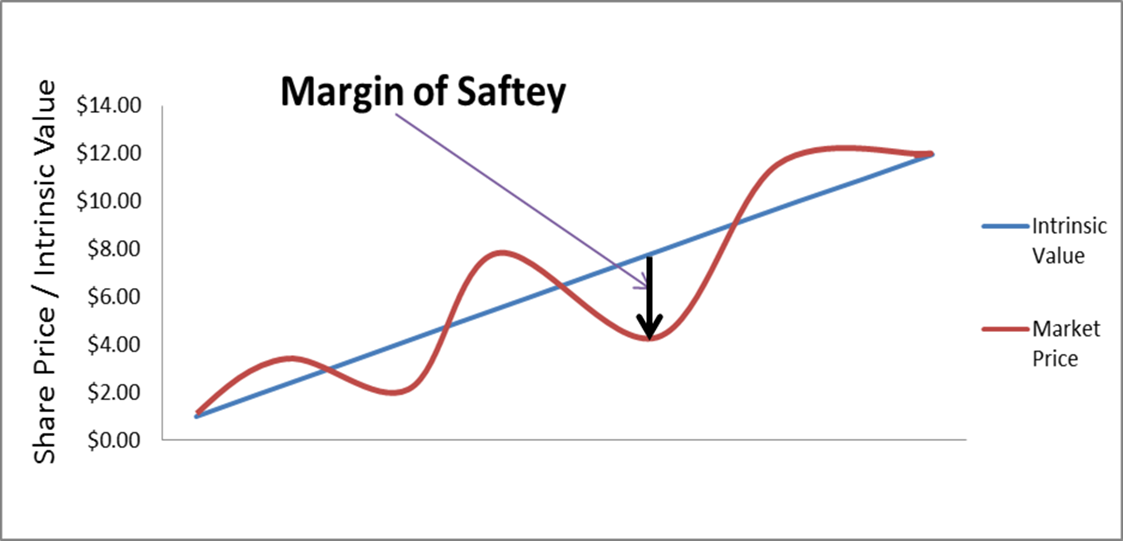
As a general observation of the market, investors are happy to buy when prices are high, and they see less perceived risk in the market. Then in turn, when the market crashes and prices plummet, they perceive this situation as high risk and sell. Logically, the margin of risk has now greatly reduced as prices are much lower than they were. If you were to purchase quality businesses at this time, your Margin of Safety has greatly increased.
To further increase your Margin of Safety (but not just by purchasing at a lower price) you should stick to businesses that you know and understand. By doing this your evaluations and future earnings predictions will have more meaning and certainty behind them. After all this, have confidence in your knowledge of the business and in your valuation and act on it.
To know what Margin of Safety to apply can be difficult. Generally, the riskier the investment the higher the Margin of Safety required. I like to set my desired Margin of Safety after first completing my checklist. I will give each checklist item a rating from 0 to 5, with 5 being excellent, 3 being average, 1 substandard and 0 being non-existent. From here I sum my checklist results to give me an overall rating and then divide that rating by the sum of the total points. For example, say we have 30 checklist items; each item can achieve a maximum score of 5 points, which would give a total of 150 points (30 checklist items x 5 points for each item). If, after conducting my analysis of the business and giving each checklist item a rating, I arrive at a total of 110 points, I would divide my score of 125 by 150, which equates to 83.3% and by inverting that number I get a Margin of Safety of 16.7%. I will then discount my calculated Intrinsic Value of a company by 16.7% which will equate to my preferred purchase price for that company. For example, if I have calculated the Intrinsic Value of a company to be about $10 per share, I will then discount this price by 16.7% to give me my purchase price for that company, which is now $8.33.
Note: The minimum required Margin of Safety which I use is 20%, so in this circumstance I would apply a 20% Margin of Safety instead of 16.7%.
Purchase Price = Intrinsic Value- (Intrinsic Value × Margin of Saftey)
= $10 – ($10 × 16.7%)
= $8.33
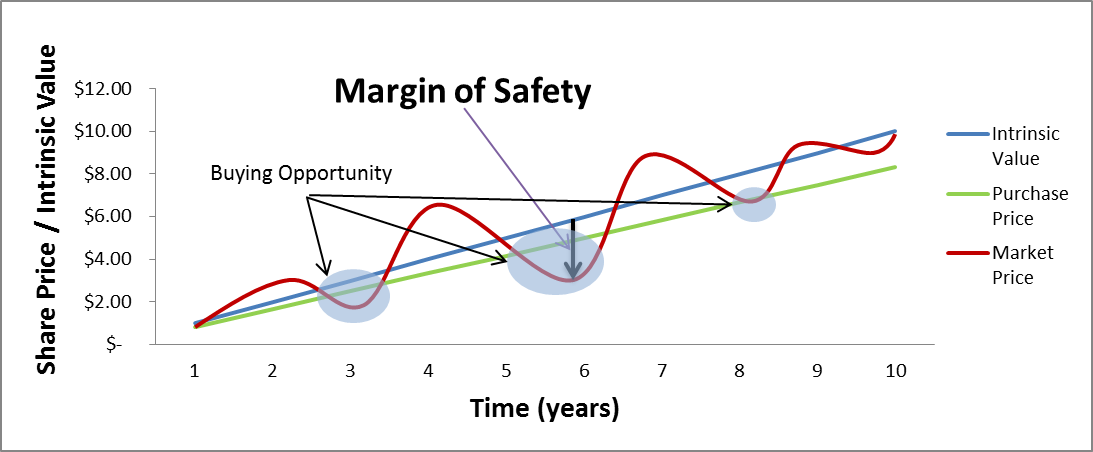
I believe this approach is a simple and relatively accurate way to asses a company’s risk and thus allowing me to incorporate a Margin of Safety into my Intrinsic Value calculation. To further express how applying a Margin of Safety works please see the graph below. It is a repeat of the graph above but this time I have included the Purchase Price (Intrinsic Value – Margin of Safety).

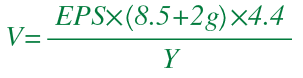
Where:
V | = | Intrinsic Value |
EPS | = | Trailing 12 month Earnings per Share[1] |
8.5 | = | Graham’s assumption of the P/E Ratio for a mature (stagnant growth) business[2] |
2g | = | 2 x the company’s projected earnings growth rate for the next 7-10 years |
4.4 | = | Graham’s estimate of a risk free rate |
Y | = | Today’s AAA Corporate Bond Rate[3] |
References:
[1] For a more conservative valuation or to avoid abnormal numbers that could occur in the trailing 12 months EPS, you can instead use an average of the Earnings over a 2-3 Year period.
[2] Investors may wish to modify this number to better reflect the current economic situation. Lowering it will result in a more conservative valuation. Between 7 and 8.5 is a good range to maintain.
[3] You can use the Discount Rate described earlier in place of the AAA Corporate Bond, for a more conservative result
The Discount Cash-Flow Method (DCF) is one of the most popular and widely used valuation techniques. It is basically the addition of all future free cash flows which have been discounted annually at the Discount Rate / Investors Required Return. This will give us the present value of the future free cash flows. The sum of these free cash flow figures is the company’s Intrinsic Value. As you will see, it is basically the same formula as the Dividend Discount Method (DDM) and the Residual Income Valuation Method (RIV) Intrinsic Value calculations.
The DCF formula comprises two parts; the first part is used to calculate the Intrinsic Value during what is generally referred to as the High Growth Period, where the company may have higher but potentially inconsistent free cash flow growth rates. This period is usually calculated out to 10 years. The second part is used for the Terminal or Stable Growth Period of the company. This is generally a more conservative estimate of a consistent rate of growth that is expected for the remaining life of the company. A stable growth rate just above inflation is usually acceptable, between 4% – 6%.
The first part of the DCF formula which is used to calculate the Intrinsic Value of a company’s High Growth Period is as follows:
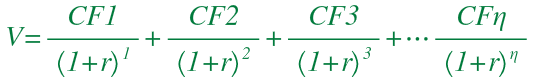
Where:
V | = | Intrinsic Value |
CF1, CF2, CF3 | = | Cash Flow for years 1, 2 and 3[1] |
r | = | Investor’s Required Return / Discount Rate |
n | = | Continuing number of years[2] |
References:
[1] You can continue to calculate the Free Cash Flow annually as far into the future you believe higher growth rates are sustainable. As a general rule, 10 years is accepted as an appropriate length of time.
[2] For example, if you were to forecast 4 years rather than 3 we would replace the n with 4, and so on.
To calculate CF1, CF2 and CF3 etc. we will use the formula below which is calculating the forecasted future free cash flow of the company, which will then be entered into the DCF formula above.
CF1=CF×(1+G)
CF2=CF1×(1+G)
CF3=CF2×(1+G) and so on…
Where:
CF1, CF2, CF3 | = | Cash Flow for years 1, 2 and 3[3] |
G | = | Growth rate (CAGR) of High Growth Period |
References:
[3] You can continue to calculate the Free Cash Flow annually as far into the future you believe higher growth rates are sustainable. As a general rule, 10 years is accepted as an appropriate length of time.
The Terminal Value (the period of consistent growth) is calculated as follows:
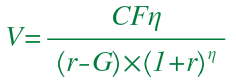
Where:
V | = | Intrinsic Value |
r | = | Investor’s Required Return (Discount Rate) |
G | = | Constant growth rate for stable period |
CFn | = | Cash Flow from the last year of constant growth |
n | = | Starting year of stable growth |
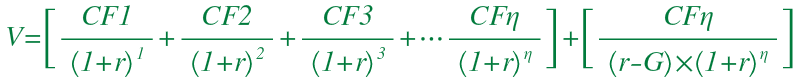
The two formulae are used in combination to give you a final valuation of the company using the Discount Cash Flow method:
The Dividend Discount Method (DDM) is another method used to calculate the Intrinsic Value of a company. It takes the forecast dividends and discounts them back to a present value. It is best used for companies that are forecast to pay a dividend into the future.
There are two methods we can use to find the Intrinsic Value of a business using the Dividend Discount Method (DDM). The first method is a simple calculation that is best suited for companies which pay a dividend that is forecast to grow at a consistent rate into the future. The second is a variation of the Discount Cash Flow (DCF) method but instead of using free cash flow, we use a company’s dividend payments.
The first Dividend Discount Method (DDM) mentioned above which is best used for companies that have a constant growth rate has three key inputs; next year’s Forecast Dividends per Share (D1), the Investor’s Required Return or Discount Rate (r) and Dividend Growth Rate (G).
The formula is as follows:
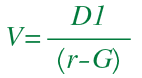
This formula makes the assumption however that the Dividend Growth Rate will be constant, which may not be realistic in some circumstances. You should also note that the Discount Rate (r) must be larger than the Dividend Growth Rate (G). If not, this formula will not work.
Where you cannot assume a constant Dividend Growth Rate, a second formula as detailed below can be used instead.
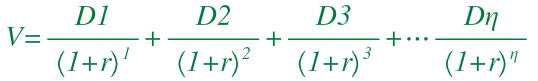
Where:
V | = | Intrinsic Value |
D1, D2, D3 | = | Forecast Dividends for years 1, 2 and 3[1] |
r | = | Investor’s Required Return (Discount Rate) |
n | = | Continuing number of years[2] |
This formula, when used on its own, can be limiting as you need to know the expected life of the company due to the fact the formula calculates each year on an individual basis and will not account for the perpetuity of a business. Conversely, in the previous DDM method which is used for a company with constant growth, it results in the present value of an infinite series of future dividends at a constant growth and thus does not account for changes in dividend growth which is often prevalent in a growing business.
References:
[1] You can continue to calculate the dividends on an individual basis as far into the future as practicable, but forecasting greater than ten years may become difficult given the increase in economic uncertainty.
[2] For example, if you were to forecast 4 years rather than 3 we would replace the n with 4, and so on.
To overcome the problems related to each formula, the first being only for a company which has constant growth and the second being the need to know the expected life of the business, both formulae can be combined. The benefit of combining the two formulae is that you can incorporate both the growth (expansionary) phase of a business with the long term (mature) constant growth phase. As seen with most businesses, there can be more prosperous periods where the company is expanding and increasing its market share. As the company matures these growth rates generally reduce and become relatively consistent.
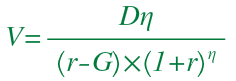
To combine these two formulae, you must first modify the original constant growth formula by discounting the dividend back to a present value as follows:
Where:
V | = | Intrinsic Value |
r | = | Investor’s Required Return (Discount Rate) |
G | = | Constant growth rate for stable period |
Dn | = | Dividend from the first year of constant growth |
n | = | Starting year of stable growth[1] |
Finally, combining the modified Constant Growth formula with the second formula from above will give us our multistage formula as shown below:
References:
[1] This is calculated by counting the number of years (High Growth Years) leading up to the year of stable growth and is not the actual year e.g. 2025.

You should be aware that the Dividend Discount Method (DDM) ignores any retained earnings, which may not matter, unless the company is able to reinvest these earnings and generate high returns on them. Therefore the higher returns generated on the retained earnings will be ignored in this method and may result in an underestimation of the Intrinsic Value of the company.
The Residual Income Method (RIV) is very similar to the previous discount methods, but this time, rather than using estimated future dividends or free cash flows of the business, we will use what is known as the Residual Income of a business. Residual Income is basically as it sounds, money that remains in a business after accounting for the cost of capital or the opportunity cost, which is the same as the Discount Rate or the Investor’s Required Return. The Investor’s Required Return or Discount Rate is applied to the company’s equity, or in this instance we will use Book Value, which is basically equity per share. This will be the company’s cost of equity and will then be taken from the earnings of the business where we will be left with the Residual Income of the business.
The formula to calculate Residual Income is:
RI = EPS – r × B
Where:
RI | = | Residual Income |
EPS | = | Earnings per Share (EPS) |
r | = | Discount Rate |
B | = | Book Value per Share |
Now that we know how to calculate the Residual Income, we can input the data into the Residual Income formula. The actual formula to calculate the Intrinsic Value of a business using the Residual Income Method (RIV) is much like other discount methods e.g. Discount Cash Flow (DCF) and Dividend Discount Method (DDM):
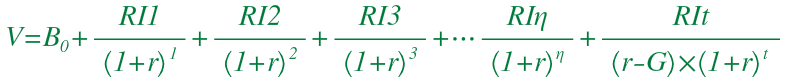
The difference here is we now also include Book Value. This is calculated from the last financial year’s Balance Sheet[1].
Where:
V | = | Intrinsic Value |
B0 | = | Book Value per Share |
RI1, RI2, RI3 | = | Residual Income for years 1, 2 and 3[2] |
r | = | Investor’s Required Return/Discount Rate |
n | = | Continuing number of years[3] |
RIn | = | Continuing Residual Income |
G | = | Residual Income Stable Growth Rate |
RIt | = | Starting Residual Income of Stable or Terminal Growth Period |
t | = | Starting year for Stable or Terminal Growth Period |
References:
[1] Book Value=Shareholders Equity/Shares Outstanding
[2] You can continue to calculate the Residual Income on an individual basis as far into the future as practicable, but forecasting greater than ten years may become difficult given the increase in economic uncertainty.
[3] For example, if you were to forecast 4 years rather than 3 we would replace the n with 4, and so on.
Compared to the Discounted Cash Flow methods and the Benjamin Graham formula above, Balance Sheet valuations are relatively simple and require little mathematical knowledge or calculations. By using figures that can be taken from the Balance Sheet of a company we can fairly simply calculate the Intrinsic Value. Using assets and liabilities recorded on the Balance Sheet will provide an estimate of the company’s worth. This is done by adding the value of its ‘hard’ assets and current assets such as cash and receivables and deducting all debts and liabilities. This does however rely on the accuracy of the figures reported in the Balance Sheet and the likelihood of those assets realising the values ascribed to them if they were to be sold today. Also the Balance Sheet Methods make no allowance for intangible assets such as intellectual property, patents, copyrights or business brands nor do they reflect future growth projections or earnings power which could positively impact on the business. Due to these factors this method will generally give a valuation that is well under the market price and other Intrinsic Value methods outlined earlier in this chapter.
A Balance Sheet valuation would be best applied to a business that is facing liquidation or has suffered a major drop in price and faces the possibility of heading into administration, in which case you may have the opportunity of purchasing shares which are trading under ‘Net Asset Value’. The difference between the Discount Methods and the Balance Sheet methods can be seen as the value given to the earnings power of the business, its future growth prospects and any intangible assets and goodwill which are inherent in the Discount Method calculations. It may not make sense using the Balance Sheet methods for companies that have little requirement for ‘hard’ tangible assets to generate its earnings.
The Book Value per share is generally calculated by first subtracting the total liabilities from total assets and then dividing that figure by the total shares outstanding, or in other words, Shareholders Equity divided by total shares outstanding. Another form of Book Value is known as Tangible Book Value which is very similar to Book Value but excludes intangible assets. Tangible Book Value is calculated by deducting intangible assets and total liabilities from total assets and dividing the resultant number by total shares outstanding.
Book Value provides a value per share of the business if it was to close down and liquidate all of its assets. It can also be seen as an indication of how much you could potentially lose if the business was to go into administration. If it is trading close to its Tangible Book Value, say within 20%, this should give you some confidence that your investment will have a potential loss of no greater than 20%. In this case the assumption is the assets have been fairly valued on the Balance Sheet and will achieve the stated price at a time of crisis such as when the business is being liquidated.
Book Value:

Or

Tangible Value:

Or

The Graham Number is calculated as follows:
Where:
V | = | Intrinsic Value |
EPS | = | Current Earnings per Share |
22.5 | = | Derived from Grahams belief that the Price to Earnings Ratio (P/E) should be no more than 15 and a Book Value of no more than 1.5 (15 multiplied by 1.5 equals 22.5)
|
The result would give an Intrinsic Value of a business, which does not take into account future growth and other fundamentals that can be incorporated in the Discount Methods shown earlier.
The Liquidation Value is a method Benjamin Graham developed to estimate a value of the assets of a business if it was to be liquidated. It is basically the Tangible Value of a business but adjusted to better represent the liquidation value of its assets. When a business is trading near its Liquidation Value, it obviously has some problems. It would be amiss of someone to expect a struggling business to be able to sell its assets and inventory at Book Value, or the value quoted on the company’s Balance Sheet. This could be due to the company’s products not being as desirable or in such high demand as it used to, or the industry in which the business operates becoming obsolete. Unless you have the ability to analyse each asset and individually estimate the current market value of the assets, you can instead refer to estimates of the recovery rates for each asset class as determined by Benjamin Graham in his extensive research. The table is as follows:
Type of Asset | Percentage of Recovery Rate | |
Recovery Rate | Median Recovery Rate | |
Cash Assets | 100% | 100% |
Receivables | 75% – 90% | 80% |
Inventory | 50% – 75% | 66.5% |
Fixed Assets | 1% – 50% | 15% |
Breakdown of each asset class
Cash Assets – Assets which include cash, government and other high grade bonds and marketable securities. These are highly liquid assets that can be bought and sold at face value.
Receivables – Assets which include moneys owed to the business (debtors). We can expect a high recovery rate from these items as customers can be held accountable for what is owed.
Inventory – Assets which include products or raw materials for sale (trading stock). Inventories can bring a lower recovery rate as growing inventories are often a pre-cursor to the liquidation. If the products being sold were still in high demand, then chances are the company would still be in business and not facing liquidation.
Fixed Assets – Assets which include plant, property and equipment. Often the plant and equipment is specialised to cater for that particular product or business and therefore if that product has become unfashionable or obsolete and the industry as a whole is struggling, then so too the business would struggle to sell its fixed assets at Book Value.
Liquidation Value of Assets = Assets × Recovery Rate
Liquidation Value = Liquidation Value of Assets – Total Liabilities
Net Current Assets Value approach is quite simple and very similar to the other Balance Sheet methods previously described in this chapter. Net Current Assets Value (NCAV) is calculated by adding up all the current assets whilst ignoring the non-current assets, then deducting total liabilities. More often than not this approach will give a negative result and will rarely exceed the current share price of the business. Benjamin Graham liked to use this method to value his businesses and then build his portfolio with undervalued businesses. He would have very diversified portfolios of up to 100 stocks to protect the portfolio from the obvious volatility that you could expect from such undervalued businesses. You would be hard pressed to find such undervalued businesses today, especially in those volumes.