Initial Public Offering (IPO) and Stock Exchanges
First I would like to explain how and why a company would proceed to be listed on a Stock Market (Stock Exchange).
A few reasons why a company would decide to ‘go public’:
- Allows the business the opportunity to raise capital during the initial offering stage, which can then be reinvested to further grow the business, as opposed to using debt to finance its growth.
- Allows the current owners of the business to monetise the value they have inherently invested in the business and sell down some of that ownership to new shareholders.
- It can raise the public profile of the business and benefit from the extra attention that is gained through the financial media.
If the current business owners wish to list the company, they will need to ensure that it meets all of the listing requirements of the relevant Stock Exchange. This can include: proven profitability of the business, a minimum number of shareholders and the size or net worth of the business, usually calculated as the total of its tangible or ‘hard’ assets. A Stock Exchange is another name for the Stock Market. Just like you have multiple markets to buy your fruit and vegetables from in varying towns, there are different Stock Exchanges (market places) operating in many countries. Sometimes a country may have more than one Stock Exchange, as is the case in United States which has the New York Stock Exchange (NYSE) and the NASDAQ Stock Market (NASDAQ). In Australia, in addition to the Australian Stock Exchange (ASX) investors may invest via the Chi-X Australia Exchange (CXA). The greater majority of the companies listed within an exchange are businesses domestic to that country, meaning the business primarily trades goods or receives profits from activities within the country in which the business is registered. There are also some businesses that are listed on multiple exchanges across the globe, for example, Australian mining company BHP Billiton Limited, which is listed on the Australian Securities Exchange (ASX) and on the London Stock Exchange (LSE). There are about twenty different Exchanges across the world in countries like, Australia, New Zealand, United States, Japan, China, South Korea, India, South Africa, United Kingdom, Spain, France and Germany.
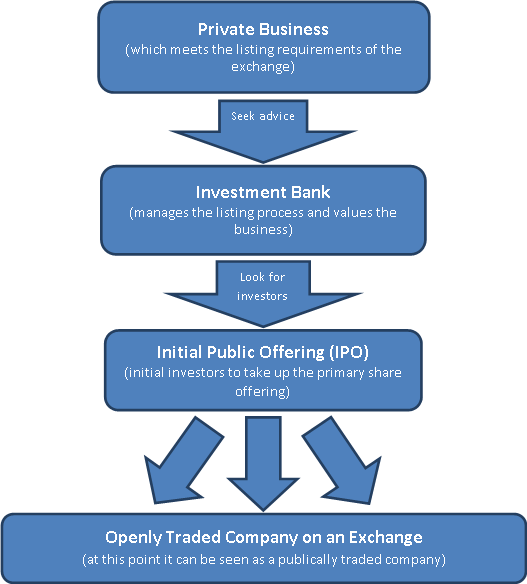
When the owners of a private company are considering listing the business on a Stock Exchange they will consult with an Investment Bank or a Stock Broking Company. The role of the Investment Bank is to manage the listing process as well as to value the company and determine an initial listing price per share. The Investment Bank in conjunction with the current owners will then appoint one or more Stock Broking Firms to raise the initial capital through their client basis.
The basic steps to become a publicly traded company on a Stock Exchange are as follows:
Shares

When you invest in a company listed on the Stock Market, you become a part owner of that company. The ownership of a company listed on the Stock Market will be spread amongst many different shareholders, all of whom may hold differing numbers of shares. The number of shares on issue will differ between companies and is dependent on many factors. These factors can include the number of shares that were offered in the Initial Public Offering (IPO); a company can issue more shares to investors to raise funds; a company may wish to repurchase shares which will reduce the amount available to the public and dividend reinvestment plans will also affect the number of issued shares. To better understand what exactly a share is we can look at the examples below.
If a business is valued at ten million dollars when it is first offered to the public during the IPO and there are one million shares available for purchase, this means each share is initially valued at $10.00.
Share Price = Value of Business/Number of Shares on Issue
Share Price = $10,000,000/1,000,000
Share Price = $10.00
If there are one million shares of a company and it is trading on the Stock Market at $2.00 per share, then that business is currently valued at two million dollars. This is known as the Market Capitalisation or ‘Market Cap’ of the company.
Market Cap = Share Price × Number of Shares on Issue
Market Cap = $2.00 × 1,000,000
Market Cap = $2,000,000
So basically if you own a share in a business you will own a fraction of that business. If the business is divided into 100 shares and you own 10 of them, you own a 10% share of that business, entitling you to 10% of the profits and voting rights.
Share Buybacks
Share buybacks occur when a company chooses to repurchase their own shares. It is possible to do this in two ways; firstly by purchasing shares on the Stock Exchange (at the current market price), just like you or I would. Secondly the company could issue a Share Repurchase Plan to its existing shareholders; this is when the company states the number of shares it wishes to repurchase and at what price. The price is usually fixed at or close to the current market price. On many occasions the buyback price is a little above the current market price, thus allowing for any increases in market price that may occur during the offer period, as well as giving the shareholders added incentive to take up the offering.
Once the company has repurchased its shares, they have two options; they can either cancel or retire the shares, which basically removes them completely from the market and eliminating the option for the company to re-offer those shares back to the public for purchase. The second option is to hold the shares as Treasury Stock which is recorded in the Shareholder’s Equity section on the company’s Balance Sheet. Holding the shares as Treasury Stock gives the company the ability to re-issue or retire the shares at a later date.
For a company to repurchase its shares, it will generally use available cash generated from the profits of the business. This is the same pool of money that is commonly used by the company when issuing dividends to its shareholders. If after repurchasing the shares the company elects to hold the shares on the Balance Sheet as Treasury Stock, it will not receive any dividends or have any voting rights on those shares. Treasury Stock are effectively ‘null and void’ unless and until the company decides to re-issue those shares to the public. The shares can be allocated to employees of the company by way of bonuses or incentives or can be re-issued to existing shareholders through a Dividend Reinvestment Plan. If the company needs to raise capital it also has the option of re-issuing the shares via a Share Purchase Plan (SPP) to its existing shareholders. This can be done by offering the shares at a fixed price, generally at a discount to market value.
It is generally seen as a positive for shareholders when the company elects to repurchase its shares. I will explain further the benefits later, but first I would like to give some examples of either positive or negative signals which may emanate from a company’s Share Purchase Plan (SPP):
- If the company uses its excess free cash flow to repurchase the shares it should be seen as a positive sign.
- If the company’s shares are trading on market at a reasonable price or preferably undervalued, that also would be a positive sign. If the shares are trading at a higher price (above Intrinsic Value, Explained further under ‘Stock Market Risks’) then maybe the excess profits that the company has generated would be better distributed to the shareholders via a dividend or reinvested into the company for further growth.
- If the company is repurchasing shares and raising debt at the same time it would send confusing signals to the market and existing shareholders. This is because rather than repurchasing shares, that money could be used in the business rather than raising debt.
- It can also often be the case that a company will repurchase shares as a way to return to shareholders any excess or growing capital (excess cash) it may have. This also is a positive sign, especially if the offer is priced as outlined in the second point above, i.e. the company’s shares are trading at a price below the company’s Intrinsic Value.
To explain why share buybacks (when done at the right time) benefit the shareholder, I think it is best to start with a hypothetical example.
For example, say we have a listed company and it has 1,000 issued shares. If the company has made a Net Profit of $1,000 dollars for the year this will equate to $1.00 per share, referred to as Earnings Per Share or EPS.
Total Net Profit / Shares Outstanding = Earnings Per Share (EPS)
Generally, out of this Net Profit or Earnings a company may elect to distribute a Dividend to its Shareholders. If the company was to issue $500 of the Net Profit as a dividend this would equate to $0.50 per share, referred to as Dividends Per Share or DPS. It is calculated the same way as Earnings Per Share (EPS), but we replace the Net Profit with Dividends paid.
Dividends Paid / Shares Outstanding = Dividends Per Share (DPS)
If an investor owned 100 shares in this company (equivalent to 10% of the company), they would receive a dividend of $50 (100 shares multiplied by DPS of $0.50).
If the company repurchased 200 of the 1000 issued shares, there would now only be 800 shares on the market. The investor with the 100 shares now would have a 12.5% holding of the company.
800 Shares Outstanding / 100 Investor Shares = 12.5%.
Assuming the company generated the same net profit the following year, the calculations for Earnings Per Share (EPS) and Dividends Per Share (DPS) would now change.
EPS = Net Profit/Shares Outstanding
EPS = $1,000/800
EPS = $1.25DPS = Dividend Paid /Shares Outstanding
DPS = $500/800
DPS = $0.625
The shareholder who previously received a dividend of $50 would now receive a dividend of $62.50 (100 shares multiplied by DPS of $0.625). This is an increase of 25%.
As you can see from this example, the investor has benefited from the repurchase of shares by the company by now being eligible for a larger share of future profits (12.5% vs 10% previously) and therefore receiving higher dividend payments.
Something to keep an eye out for as well is that Share Buybacks will also affect other reported ratios; this is due to the way these ratios are calculated using the Shares Outstanding, Market Price as well as the Assets and Liabilities and Shareholder’s Equity which may be affected when a company performs a Share Buyback. The ratios affected include Earnings Per Share (EPS), Dividends Per Share (DPS), Price to Earnings Ratio (P/E Ratio), Price to Book Value Ratio (P/B Ratio) and Return on Equity (ROE) to name a few. This is important to note when looking at a company’s historical performance as these ratios may have changed if a Buyback occurred in the past.
Volume and Liquidity

If you watch the stock price of a company over a day, you will see that it is constantly changing, depending on the number of people wanting to buy or sell the shares of that particular business. If it is a company with a larger Market Cap it will generally have more people wanting to buy and sell shares which will increase the number of transactions or trades between investors. The number of shares traded is known as Volume. Volume determines how many shares have sold over a period of time, generally measured over the course of one trading day. The more trades which occur mean that the stock is more ‘liquid’. Liquidity is a measure of how easily it is to sell or buy shares of a company. If a company is highly liquid this will mean that you should not have a problem finding a buyer for your shares, or vice versa you should easily find someone willing to sell you their shares in the company. Liquidity is important to understand, as the more liquid the company the less chance you will be left with a bunch of shares that you cannot sell. For example, say we purchase some shares of a smaller Market Cap company at $0.10 a share and if this company is rarely traded, meaning there is a low Volume, then the company will be described as having poor liquidity. This could affect us when we come to sell, because if there is no one wanting to buy our shares, we may have to keep lowering the price until we can find someone that will purchase them, which means waiting until more buyers become interested in the company.
The Price of a Share
This ties us in to our next point; who sets the price of a share? As we just discovered it is easier to buy and sell shares when there is more volume/liquidity and it can be more difficult to buy and sell shares if there is less volume/liquidity, we can now better understand the pricing of a share. It is important to understand that when you purchase or sell a share, you are making that transaction with another person, not a machine or computer somewhere. You set your price and they will set their price and if the prices match then you have made a successful transaction. These buy and sell prices are often referred to as the bid and offer price. The bid price is the price the buyer is willing to pay for the shares, and the offer price is the price at which the seller is willing to sell their shares. You will often see a table similar to the one below, detailing the volume of shares available to buy or sell, at what price they are available and the number of investors who are buying or selling at that price.
Bids (buyers) | Offers (sellers) | ||||
Number | Volume | Price ($) | Price ($) | Volume | Number |
5 | 1000 | $1.10 | $1.12 | 1500 | 7 |
6 | 1500 | $1.09 | $1.13 | 1250 | 4 |
4 | 2000 | $1.08 | $1.14 | 1200 | 5 |
3 | 3500 | $1.06 | $1.15 | 3000 | 3 |
2 | 1000 | $1.05 | $1.16 | 3000 | 3 |
2 | 2000 | $1.02 | $1.18 | 1000 | 1 |
The table indicates in the first row there are 7 people who together have a total of 1500 shares for sale at $1.12 and 5 people who are willing to purchase a total of 1000 shares at $1.10. Note that the Number column is the number of investors willing to buy or sell shares at a particular price and the volume is the total shares being bid or offered. At the situation shown above, no transactions will occur until a buyer or seller is willing to change their price or another investor enters the market at the price indicated. For example, if one of the five buyers on the table above, who happens to be wanting to purchase 250 shares of the total volume of 1000 shares, increased their bid to $1.11 per share and one of the seven sellers who has 350 shares available was to decrease their offer to $1.11, a transaction would occur. The buyer would be happy as they now have bought 250 shares at $1.11 a share, but the seller, who had 350 shares, will still have 100 shares remaining available to sell. (Side note, it is easy and free to change, amend or cancel your open orders on the market).
Now the table will look like this:
Bids (buyers) | Offers (sellers) | ||||
Number | Volume | Price ($) | Price ($) | Volume | Number |
4 | 750 | $1.10 | $1.11 | 100 | 1 |
6 | 1500 | $1.09 | $1.12 | 1150 | 6 |
4 | 2000 | $1.08 | $1.13 | 1250 | 4 |
3 | 3500 | $1.06 | $1.14 | 1200 | 5 |
2 | 1000 | $1.05 | $1.15 | 3000 | 3 |
2 | 2000 | $1.02 | $1.16 | 3000 | 3 |
The number of buyers has now dropped to 4 along with the volume falling to 750. On the seller’s side, we still have the previous investor’s remaining 100 shares available at $1.11 per share. The original 1500 shares offered at $1.12 is now only 1150. This is due to the 350 shares being amended by the investor to be sold at $1.11 instead of $1.12. Of those 350 amended shares, only 250 were sold, hence the investor still has 100 shares remaining at $1.11 per share.
If there is more than one investor wanting to buy or sell shares at the same price, the ‘first in best dressed’ rule applies. Meaning if you are the last investor to offer your shares for sale at a certain price, your shares will be added to the end of the list and will be the last to be sold at that price. You may find yourself waiting for enough investors to come along who are willing to purchase the shares at that price.
How to Purchase a Share

Anyone can participate in the stock market. You will first need to open a brokerage account. This can be online with your Bank or Broker or by direct contact with a Stock Broker. Generally in most countries you are required to be an adult (18 years) before you can open a personal account. But there are ways to start investing before you become an adult by either using a trust account or have a parent/guardian open an account on your behalf. Online brokers will tend to be cheaper compared with opening a (full service) brokering account. It is usually free to open an account and most times this can be done online in about 30 minutes. You may be required to confirm your identity and send in copies of some identifying documents. Once you have an account you will be charged brokerage for each transaction you complete and these costs vary depending on the broker you chose. In my experience for trades under $20,000 brokerage will generally be $15 – $20. Orders can be easily amended or cancelled free of charge and you should only be charged brokerage when you purchase or sell shares. Some accounts may have a minimum amount per transaction e.g. $500. Also be aware that once orders start to become larger, say over $20,000, you may be charged a percentage of your transaction rather than a flat fee.
Sectors and Industries
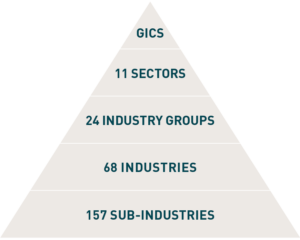
The majority of Stock Markets are classified using the Global Industry Classification Standard (GICS). It was developed in 1999 by Morgan Stanley and Standard & Poor’s. The primary purpose of the GICS is to assign companies to a Sub-Industry and then to a corresponding Industry, Industry Group and Sector.
To the right is a pyramid chart of the classifications and sub classifications. As you can see, there are 11 different Sectors, 24 Industry Groups, 68 Industries and 157 Sub-Industries. These standards are able to be modified to cater to the changes in industries as well as incorporate new and changing technologies.
Understanding each sector and in which industry your investments are located can help if you wish to diversify your portfolio (I explain diversification later in the eBook). It is also an easy way to filter out companies if using a stock filter. You have the ability to remove industries or sub industries that may not be in accord with your values or just simply an industry that you would like to avoid.
You may find on occasion, that the market or investors can be attracted to or have an aversion to a particular sector or industry group. If this occurs it will generally have an impact on the share prices of companies included in that industry sector. This can be due to what may be legitimate reasons like changes in technology, increased competition, or changes in demand for the output of that industry, but could also be caused simply by an increase in media attention and the industry being the ‘flavour of the month’. When a swing in a certain Sector or Industry does occur, it could be instigated by only a few companies. This swing will generally be caused by the larger companies within the industry which can tend to bring the rest of the industry along with them. When there is negative hype surrounding a particular industry and that industry or sector has had an across-the-board sell off, it can be beneficial to look closely at the cause. If the sector sell off is due to some news that in the long run, will have little effect on the sector, but the market has overreacted to the media hype, you may find this a great opportunity to invest in some quality businesses at discount prices. But be sure that you fully understand the cause of the sector sell off and of course include thorough investigation of the business before you choose to invest.
Dividends
Dividends are ‘usually’ paid out of the profits of a business and then distributed to its shareholders usually on a regular basis, generally six monthly in Australia and quarterly in America. When I say profits, that isn’t to say that a business will always have made a profit from which it pays a dividend. It is not unheard of for companies to draw from its reserves or to even take a loan to pay a dividend. This may sound counterintuitive, which may well be the case in most scenarios, but it is often done to appease the shareholders and maintain the share price. Most times there is a correlation between the stability of the dividend payments of a company and its share price. So companies which may have a temporary fall in net profits (profit after expenses, tax and interest payments), may need to look elsewhere for funds to maintain their steady dividend payments and hopefully prevent a drop in share price. If something like this happens on a regular basis it may be a warning sign to avoid investing in that particular company.
Franking Credits
Prior to 1987 before the Dividend Imputation Scheme (DIS) was introduced, dividends paid by a company out of its after tax profits and received by a shareholder, would be included in the shareholder’s taxable income and then taxed at their Marginal Rate of Tax (MRT) i.e. a form of double taxation.
After 1987 however, when companies paid dividends out of their after tax profits, those dividends would come with a Franking Credit (Imputed Tax Credit) for the tax already paid by the company which could be used by the shareholder to offset against the tax which they would otherwise pay on that dividend. This meant the shareholder would only have to pay tax on a Franked Dividend where their Marginal Rate of Tax (MRT) was above the company rate of tax, thereby ending the double taxation of company dividends.
An enhancement to the DIS in the year 2000 made Franking Credits fully refundable to a shareholder which effectively provides a cash refund (partly or fully) of Franking Credits where the shareholder’s MRT is less than the company tax rate.
The following examples and table below will help to explain the principle of the Dividend Imputation Scheme (DIS):
For this example we will use four individual investors who each have a different income tax rate. They each hold 500 shares in company XYZ and purchased these shares at $10 each, leaving each investor with a total investment of $5,000.
Company XYZ has made a profit of $1.00 per share (known as Earnings Before Interest and Tax or EBIT). From this profit they are required to pay tax at the company tax rate (which is at time of writing between 27.5% – 30% in Australia and is dependent on the size of the business). For this example company XYZ has a company tax rate of 30%, meaning they are required to pay 30 cents in the dollar of tax.
Tax Paid = Profit × Tax Rate
Tax Paid = $1.00 × 30%
Tax Paid = $0.30
This leaves the company with a net profit of $0.70 per share (known as Earnings Per Share or EPS). From this the company can either elect to retain some money for growth or pay a dividend to its shareholders. For this scenario, company XYZ elects to pay 50% (known as the Payout Ratio) of its EPS as a dividend, which equates to a dividend of $0.35. As each of our four investors has 500 shares, this will mean that they each receive a dividend payment of $175 (500 shares x $0.35 dividend), which is a Dividend Yield of 3.5%.
Dividend Yield = Dividend /Investment
Dividend Yield = $175/$5,000
Dividend Yield = 3.5%
You can calculate on a per share basis as well to give you the same result
Dividend Yield = Dividend Per Share/Share Price
Dividend Yield = $0.35/$10
Dividend Yield = 3.5%
Depending if the company has paid its full tax rate on their profits for the year determines at what percentage the dividends can be franked, be it fully franked (100%) or partially franked. For example, if a company has made a loss in a previous year they may be able to carry this forward to offset any future profits and thus not have to pay the full rate of tax for the year. Or they may have produced some of their earnings overseas and subsequently paid tax in that country, resulting in them not receiving any franking credits from that proportion of earnings. If a company, for whatever reason, is not required to pay its full tax rate and subsequently misses out on receiving some of its Imputation Credits, it may still have some credits available from previous years that it can use to maintain a 100% Fully Franked Dividend. These saved Imputation Credits can also be payed out as a Special Dividend.
For example, in its first year, company XYZ made a profit of $100, subsequently paying $30 (or 30%) in tax, which is its total required tax payment and thus is entitled to $30 of imputed tax credits which means they have the option to issue all of its earnings as a Fully Franked Dividend.
Net Profit After Tax | $70 |
Tax (30%) | $30 |
Payout Ratio | 100% |
Dividend | $70 |
Imputation Credit to Shareholders | $30 |
Imputation Credit Retained | $0 |
Total or Grossed up Dividend | $100 |
In this scenario the company has used all of its available Imputation Credits. It has no credits to retain and utilise in a future year.
If the company decided to only payout 50% of its earnings, its Dividend would be halved to $35 and the Imputation Credit to the shareholders will also be halved to $15. But now the company has the remaining credit of $15 available to use at a later date.
Net Profit After Tax | $70 |
Tax (30%) | $30 |
Payout Ratio | 50% |
Dividend | $35 |
Imputation Credit to Shareholders | $15 |
Imputation Credit Retained | $15 |
Total or Grossed up Dividend | $50 |
Now to put it all together we can look at the tables below to see the impact Dividend Franking has for shareholders and how they can be of great benefit.
Investor 1 | Investor 2 | Investor 3 | Investor 4 | |
Tax Rate (%) | 0.0% | 19.0% | 32.5% | 37.0% |
Dividend ($) | $175 | $175 | $175 | $175 |
Imputation Credit ($) | $75 | $75 | $75 | $75 |
Taxable Income ($) | $250 | $250 | $250 | $250 |
Gross Tax Payable ($) | $0.00 | $47.50 | $81.25 | $92.50 |
Franking Credit Rebate ($) | $75 | $75 | $75 | $75 |
Tax (Payable)/Refundable ($) | $75 | $27.50 | ($6.25) | ($17.50) |
After Tax Income ($) | $250 | $202.50 | $168.75 | $157.50 |
After Tax Equivalent Yield of $5,000 Investment (%) | 5.00% | 4.05% | 3.38% | 3.15% |
To help illustrate the benefit of Franking Credits I have included another table with the same scenario, but this time there are no available Franking Credits.
Investor 1 | Investor 2 | Investor 3 | Investor 4 | |
Tax Rate (%) | 0.0% | 19.0% | 32.5% | 37.0% |
Dividend ($) | $175 | $175 | $175 | $175 |
Imputation Credit ($) | $0 | $0 | $0 | $0 |
Taxable Income ($) | $175 | $175 | $175 | $175 |
Gross Tax Payable ($) | $0.00 | $33.25 | $56.88 | $64.75 |
Franking Credit Rebate ($) | $0 | $0 | $0 | $0 |
Tax (Payable)/Refundable ($) | $0 | ($33.25) | ($56.88) | ($64.75) |
After Tax Income ($) | $175 | $141.75 | $118.12 | $110.25 |
After Tax Equivalent Yield of $5,000 Investment (%) | 3.50% | 2.84% | 2.36% | 2.21% |
***
Calculations:
Tax Rate = Your personal tax rate at which the dividend will be taxed
Dividend = Dividend received
Imputation/Franking Credit = ((Dividend × Tax Rate) / ((1 – Tax Rate))) × Franking Rate
Imputation/Franking Credit = (($175 × 30%) / ((1 – 30% ))) × 100%
Imputation/Franking Credit = $75Grossed Up Taxable Income = Dividend + Franking Credit
Grossed Up Taxable Income = $175 + $75
Grossed Up Taxable Income = $250Gross Tax Payable = Taxable Income × Tax Rate
Gross Tax Payable = $250 × 19%
Gross Tax Payable = $47.5Tax (Payable)/Refundable = Gross Tax Payable – Franking Credit Rebate
Tax (Payable)/Refundable = $47.50 – $75
Tax (Payable)/Refundable = $27.50
Note: Tax Payable is the net tax payable by the shareholder after allowing for the Franking Credit and Tax Refundable is refunded by the Tax Office once you have lodged your tax return.
After Tax Income = Dividend +/– Tax (Payable)/Refundable
After Tax Income = $175 + $27.50
After Tax Income = $202.50
Or for Investor 3 or 4 you would be deducting tax as their tax rates are above the company’s tax rate of 30%. E.g. $175 – $6.25 = $168.75 for Investor 3
After Tax Equivalent Yield % = (After Tax Income / Investment)×100
After Tax Equivalent Yield % = ($202.50/$5000.00)×100
After Tax Equivalent Yield % = 4.05%
***
As you can see, Franking Credits can be of great benefit to the shareholder and it is of no extra cost to the company. Most times you will see a 100% allocation of Franking Credits, meaning the shareholders will receive a credit for the tax paid by the company. It is possible however for a company to only pay a partially franked dividend. As explained earlier this mainly occurs when a company either receives a large amount of its earnings from overseas or has carried forward losses from previous years and doesn’t need to pay tax until these losses have been used up.
Dividend Reinvestment Plan (DRP)

There are two ways to benefit from a dividend; one is to receive a cash payment and the second is the option to reinvest those dividends by purchasing more shares of a company via a Dividend Reinvestment Plan (DRP). (Note: Not all companies offer a Dividend Reinvestment Plan). If a DRP is available however, then shareholders have the option to reinvest anywhere from 0 – 100% of their dividend into the DRP. For example, if you own 300 shares of company XYZ and they are trading at $28.00 a share and have issued a $1.00 dividend, then you can expect to receive $300 in dividend payments. If you have elected to have a 50% DRP and 50% cash dividend then you would receive $150 in cash and the remaining $150 will be available for you to purchase more shares according to your DRP (the purchase of shares is automated once you have elected to join the DRP). If you had $150 available to purchase more shares and they were trading at $28 a share then you have the option to buy five shares ($150/$28), which will leave you with $10 remaining to add to future purchase of shares via the DRP.
Example:
$150 DRP / $28 per Share = 5.36 shares, or 5 full shares.
5 shares x $28 per share = $140 of the dividend is reinvested using our DRP and the remaining $10 will be available for future use.
In Australia you can only own/purchase whole shares, meaning we don’t have the option to buy 5.36 shares to take full advantage of the DRP in reference to the example above. The remaining 0.36 shares that cannot be purchased are equal to $10. This $10 is then held until further dividends are received, then they are combined. For example, say in six months’ time we receive another $1.00 per share as a dividend payment, our dividend payment will now apply to 305 shares (the 5 shares that we acquired through the DRP are now added to our total holding) each receiving a dividend payment of $1.00, which equals $305 (305 shares x $1.00 dividend). If we still maintain the 50% split between a cash dividend and a DRP, we will receive $152.50 as a cash payment and $152.50 will be used to repurchase more shares. As we have the $10 available that was left over from the previous dividend, this gives us a total of $162.50 available for reinvestment. To keep things consistent, let’s assume the share price is still $28. This will mean that we still have the option to only purchase five more shares, but this time we have $22.50 to be carried over for later use. It is also important to note that this $22.50 or any leftover funds that remain in the DRP for that matter do not receive any interest payments and do not change with the changing share price or if there is a change in the dividend payment from the company. It is just like cash sitting in the bank with 0% interest.
Some facts about Dividend Reinvestment Plans (DRP):
- DRP’s which are offered by companies listed on the Australian Securities Exchange (ASX), will only be available to Australian or New Zealand Residents.
- A DRP will only allow an allotment of whole shares in Australia, whereas partial share allotments are available in America.
- Any remaining DRP balance is carried over until one full share can be purchased and any remaining funds do not receive interest or any other type of benefit.
- Any shares purchased using the Dividend Reinvestment Plan are free of brokerage.
- You are still required to pay tax on the full dividend that you receive (cash and DRP).
- DRP shares are added to existing shares and are not seen as being any different. They too will also receive a dividend.
- The share price which is used for the purchase of shares via a DRP is generally the average price starting from the deadline to participate in the DRP up until the issue of the dividend. This average share price is often discounted by the company at between 2% and 5%.
- The shares that are issued to the investor via a DRP are usually either new shares which are allocated directly to the shareholders or have been repurchased from the market by the company then redistributed via the DRP.
Stock Market Flow Chart
I have included a flow chart that I made with the hope to give an overall visual picture of a business’s operations and the process that is involved for it to become a publically traded company and an overview of how the Stock Market functions.
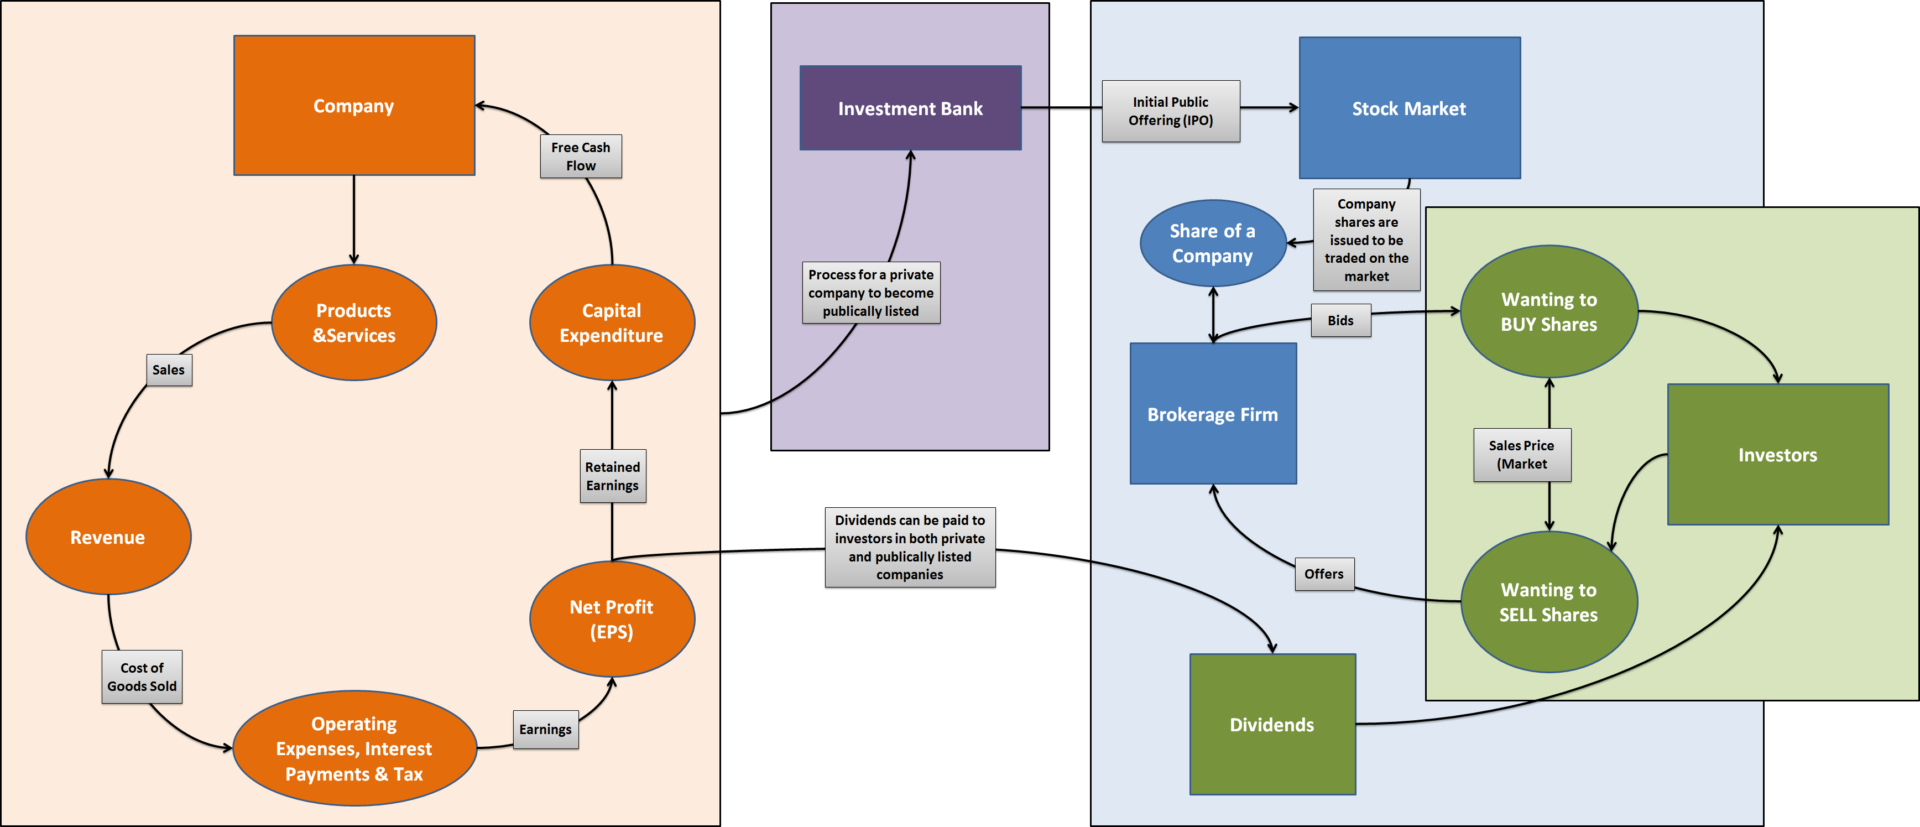
(click image to expand)